Special MASW content on theory, concepts, innovations, concerns, and credits
Understanding the math and physics behind MASW seismic applications is essential, yet appreciating this method requires more than mastering its technicalities. It’s just as important to comprehend the issues and creative solutions that have propelled it forward. In this section, we’ll explore these topics in a light academic fashion.
Our discussions and discoveries provide an expansive view of essential MASW seismic topics, with easy access to supplemental information. All of this wouldn’t be possible without generous contributions from people all around the world, so at the bottom of the page we are giving credit where it’s due by providing a short list of credits and references. This is just a brief selection though – while no one has been deliberately left out, it would be virtually impossible to mention everyone!
Theory and concepts behind MASW seismic analysis
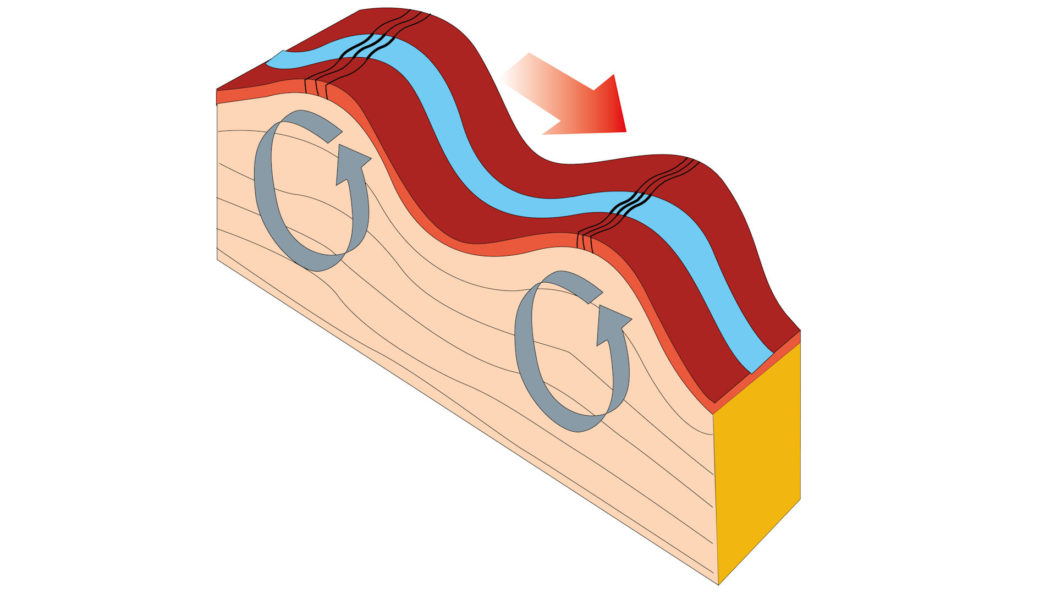
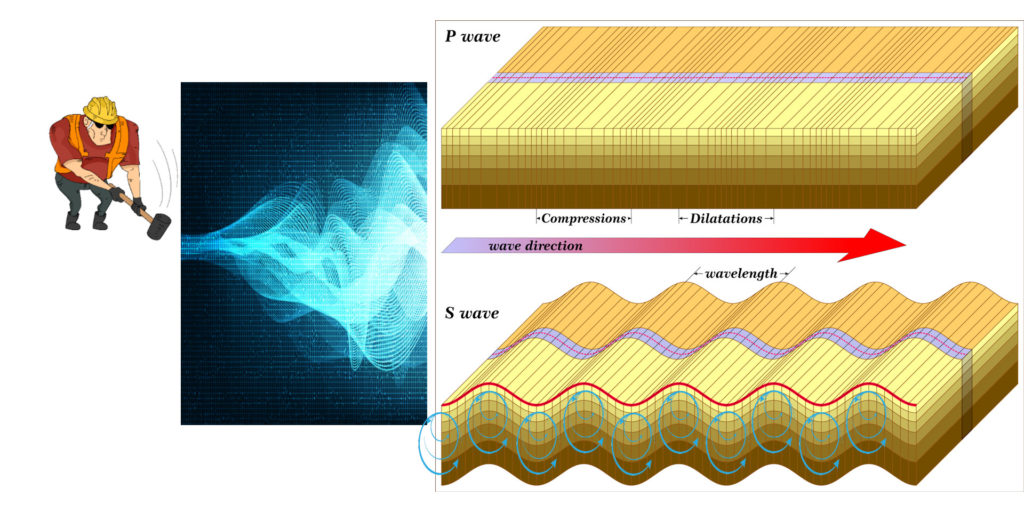
Seismic waves are mechanical (as opposed to electromagnetic) and travel through the Earth’s surface. Rayleigh waves, which are analyzed during a MASW survey, make up one of two major types of elastic surface vibrations–the other being Love Waves. Love waves oscillate back and forth across the earth’s surface. Visually, Rayleigh waves create a circular rippling motion which is similar in motion to an ocean wave. Moreover, the depth of penetration in the ground is determined by their wavelength or size oscillations with larger waves traveling deeper than smaller ones. Given that Love waves are more difficult to analyze these days and less abundant, dispersion analysis of surface waves depends primarily on the availability of Rayleigh waves. Estimates suggest that two-thirds of seismic wave energy comprises surface waves (Heisey et al., 1982).
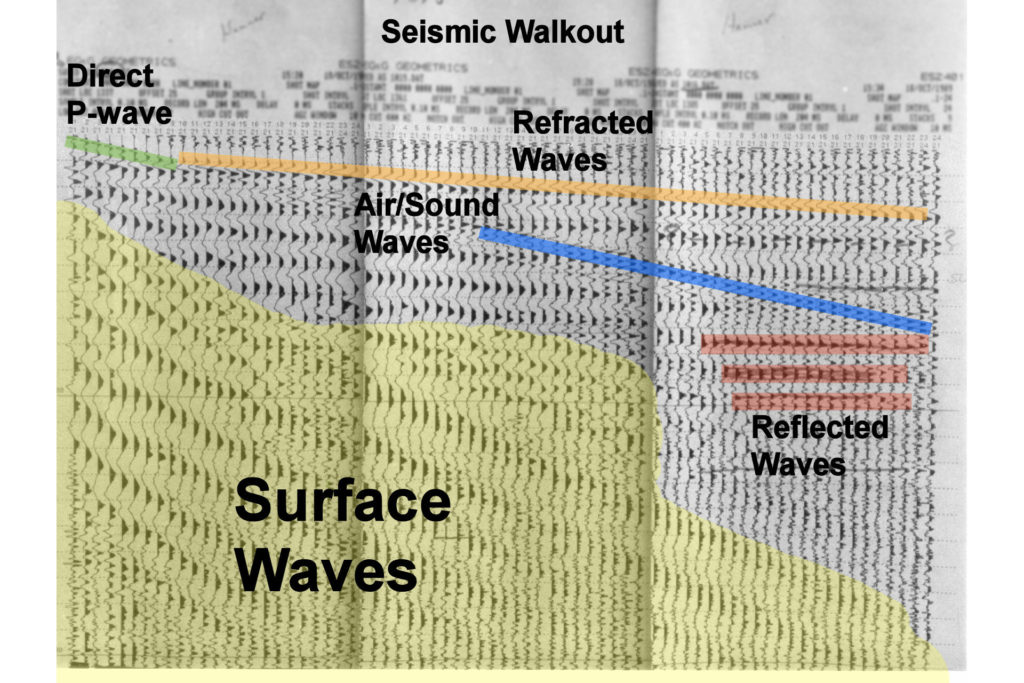
Before the introduction of dispersion analysis for surface waves, near-surface common depth point (CDP) seismic reflection surveys were conducted with meticulous attention to minimizing any generated surface wave activity. In the past, data acquisition for CDP seismic reflection surveys required intricate optimization of both source-receiver distance and geophone spacing. Reflection surveys had to be optimized to maximize P-wave reflections while minimizing surface wave or ground roll noise. Unless one paid close attention to the seismic field record, surface waves could overpower valuable P-wave reflections, making it a challenge to process the data for reflections. The issue was serious enough that it was standard practice to start a reflection survey by conducting a “walk-out” or test record. Doing this allowed the operator to visualize potential windows in the data with adverse levels of ground roll. This policy enabled the operator opportunity to adjust the survey geometry to minimize unwanted seismic energy. In contrast with today’s MASW seismic surveys, dispersion analysis depends on surface waves or the unwanted seismic energy that reflection surveys despised.
Sources of Surface waves
Surface wave research has two main sources or categories of seismic energy for near-surface applications: active and passive. Passive sources can range from naturally occurring events, such as earthquakes, to man made vibrations like those emitted by cars, trucks, buses, trains, jets, construction sites, or factory operations. These are often collectively referred to as passive microtremor or passive sources. The one characteristic that passive sources share is that they weren’t purposefully created at a pinpoint moment in time. Energy levels and when passive waves happen can be, more often than not, unpredictable, beyond your control, and random occurrences.
In contrast, active sources can generate surface waves with pinpoint precision at a distinct time. The relative position of the source to the geophones is precisely set by an operator in the field who also controls the separation and geometry between the source and receivers. There are several types of active sources used in MASW seismic surveys, each with its own unique characteristics and advantages. As examined in greater detail below, active sources include sledgehammers and plates, weight-drops, vibratory, and explosives, along with other imaginative solutions. Before MASW, active sources were mostly used to create compressional P-waves. However, as one can see in the seismic record, a very large portion of the seismic energy created from an active source consists of surface waves.
Passive microtremor sources of Surface waves
It bears repeating, geologic events, environmental forces, or human activities produce a large portion of the passive microtremor energy. For the most part, a field operator lacks control over generating these kinds of surface waves on demand and where they are produced. Higher frequency passive sources are often absorbed because they travel over enormous distances. As a result, most of the passive energy recorded by a surface wave seismic survey consists of longer wavelengths and lower frequencies. This also means that these sources reach greater depths (lower resolution) than active sources do. Making them useful for characterizing conditions at greater depths.
Surface waves caused by geological disturbances or environmental conditions are easy to imagine. Earthquakes, wind, and wave motion all contribute to these sources of surface waves. On the other hand, humans generate less recognizable passive microtremors. Human activities regularly generate energy in the form of spontaneous Rayleigh waves, which are recognized as passive energy. These activities often include large, heavy, and moving objects. The height and speed, of the objects or equipment being dropped or bounced on surfaces, determine how much wave energy is released. Take railroad cars rolling over tracks that have not been welded together or trucks driving through potholes – these generate surface waves. Other passive microtremor generated by humans include excavations, building demolitions, mine blasts, and factory operations, all capable of producing surface waves.
Active sources of surface waves
Active MASW sources are manmade. Overall, the choice of the active source depends on the specific requirements of each MASW survey, including target depth, signal strength, and site conditions. By carefully selecting an active source, geophysicists can obtain more accurate and reliable data for a wide range of near-surface applications.
Sledgehammer
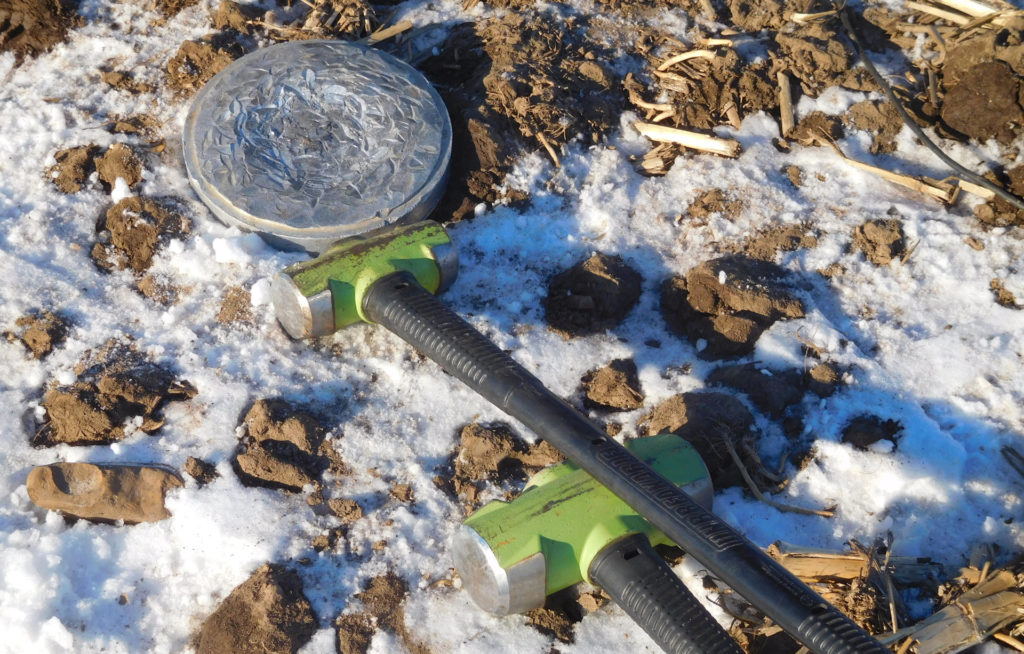
A sledgehammer involves striking a metal plate to produce surface waves. This is a cost-effective, portable, and reliable method that can be used in a variety of environments, including urban areas with limited accessibility.
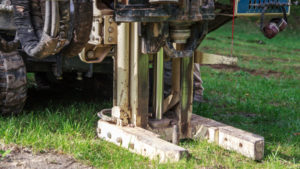
Weight Drop
Another type of active source is a weight drop, which involves dropping a large weight onto a metal plate to generate surface waves. This method is particularly useful for deeper subsurface investigations, where higher energy longer wavelength Rayleigh waves are required to penetrate the ground.
Vibratory Sources
A third type of active source is the vibratory source, which uses a vibrating head or hammer to generate surface waves at, more or less, selected frequencies. This method is ideal for obtaining higher-resolution data in shallow subsurface investigations, where smaller wavelength signals are needed.
Explosives
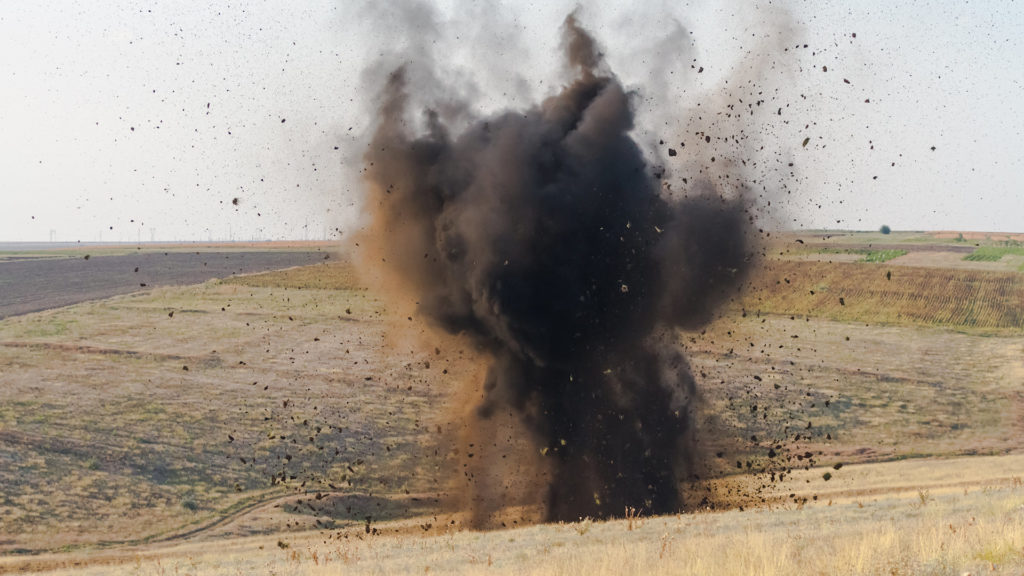
Finally, there is the explosive source, which involves detonating small explosives at specific depths to generate surface waves. This method can produce the greatest energy levels, which penetrate the deepest into the subsurface. At the same time, explosive sources are of little value for shallow investigations.
Carefully selecting active sources is an essential step to success.
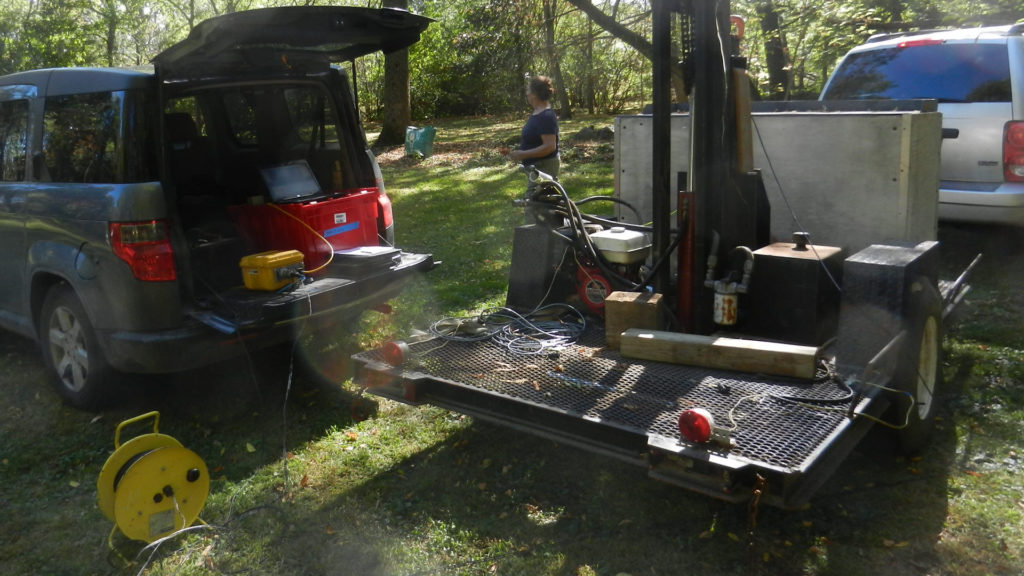
When searching for the ideal MASW source suitable to your needs, there are several elements to remember. Most active MASW surveys deploy a sledgehammer and plate, a weight drop (such as an Elastic Wave Generator (EWG), Propelled Energy Generator (PEG) or GISCO seismic source), or a heavy vibrator. By the same token, others opt for modified guns and explosives. When considering the practicality of an active source, safety is paramount. While there may be no reason for modified shotguns, rifles, or explosives to be harmful in and of themselves, if something were to go awry, they would likely pose a more substantial risk than that posed by a sledgehammer.
It is also important to note that trying to manipulate a trailer or vehicle mounted active source can be troublesome – unless you’re on a road, in an open field, or have easy site access. When this isn’t possible, the only practical approach is using a sledgehammer and plate or vibrator. Not only is it secure, but a sledgehammer and plate have the advantages of being easy to use as well as requiring minimal brush removal when in overgrown areas. For deeper depths, an effective option would be either a heavy-duty vibrator or a small weight drop. If you’re looking for depths greater than 150 feet, however, an EWG that weighs 750 pounds will do a better job.
How much energy can an active MASW source produce?
Although the above considerations are significant, generating surface waves is the main dilemma when stacking does not deliver productive results. Fortunately, creating surface waves is easier than generating higher frequency P-waves for a seismic refraction or reflection investigation. For further information, one must explore Miller, Pullan, and their colleagues’ paper from the late 1980s entitled Field Comparison of Shallow Seismic Sources. This project was intended to help operators pick out a shallow seismic reflection source that would minimize surface waves or ground roll – exactly contrary to today’s goals. The amount of effort put into this study is highly commendable.
According to the research paper, there is a stark contrast between good sources for seismic reflection and surface waves; some of the most unfavorable in one group can be surprisingly advantageous in another. That is to say, the paper confirms that some of the lowest rated seismic reflection sources are bad because they are excellent sources of surface waves. According to my assessment, the sources mentioned in this paper may be categorized into four distinct groups – those that are excellent for producing surface waves and yielded weak seismic reflections all the way up to worst generators of surface waves and consequently best for P-wave seismic reflection surveys.
- The best group of active sources for surface waves were explosives and a weight drop assisted with high pressure compressed air.
- The second best group of active sources consisted of a 300 lb weight drop (Brutus), an elastic wave generator or EWG, a Dynasource, and 8 ga. Buffalo gun. In contrast, good seismic reflection sources like a modified 50 ga. rifle, 8 ga. Betsy, 10 ga. Buffalo gun, and Mini-primacord came in second to last in the paper.
- Third group included a formidable 16 lb sledgehammer with a 12 ga shotgun not far behind a Buffalo gun. A fit person swinging a 20 lb sledge may do better than a 16lb sledgehammer.
- A modified 30-06 rifle and a 10 KW sparker produced the least amount of surface wave energy, making them a good option for a CDP near surface reflection surveys (poor source of surface waves).
What is the dispersion of surface waves
Dispersion is, more or less, when a wave’s velocity is dependent on its frequency and wavelength. In other words, the phase velocity (velocity for a set frequency) of a surface wave increases with an increase in wavelength. In geological environments, dispersion phenomena leads to high frequency surface waves having shorter wavelengths. Conversely, low frequency surface waves have longer wavelengths for a fixed phase velocity. Furthermore, studies have shown surface waves with short wavelengths do not penetrate the subsurface very far; whereas long or large wavelength surface waves penetrate to greater depths. Thus, the analysis and interpretation of dispersion images, take advantage of this relationship Subsequently, the analysis of dispersion images lends itself to characterizing the subsurface.
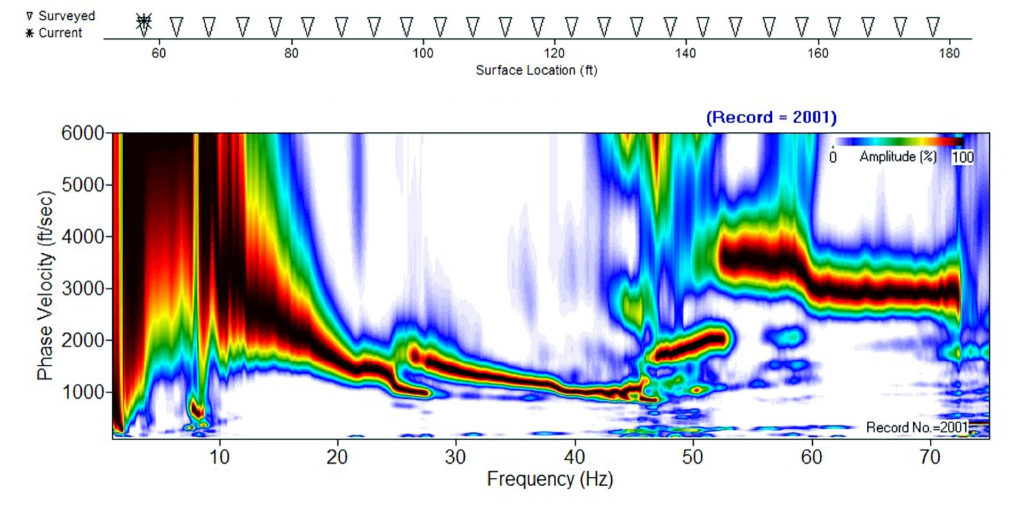
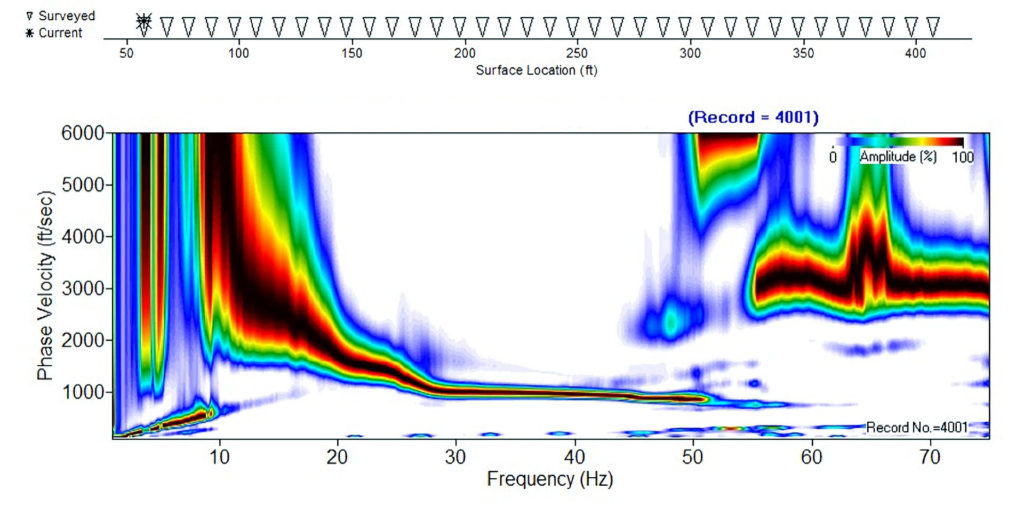
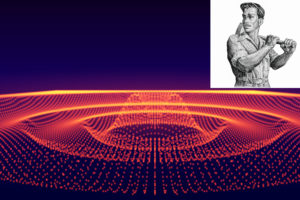
What are dispersion images?
Unless a person possesses exceptional capabilities, the best way to identify the dispersion features of a seismic record is by using dispersion images or overtone images. This graphical representation illustrates a surface wave’s phase velocity spectra or phase velocity as a function of frequency. By utilizing these visuals, an operator can easily visualize the dispersion characteristics of a recorded MASW seismic record.
When all goes as planned, a well-designed surface wave survey, which is optimized for depth and resolution, should result in dispersion images that clearly distinguish the fundamental mode from higher modes. Alternatively, substandard dispersion images make isolating the fundamental mode laborious or almost impossible to interpret. If this occurs, the interpreter can mistakenly select higher mode results when extracting dispersion curves. As a result, the extracted fundamental mode could mistakenly contain higher phase velocities or aliased low frequency responses, resulting in unsatisfactory inversion results.
What is the fundamental mode
Above we discussed the fundamental mode under dispersion images. The fundamental mode or M0, more or less, represents the lowest or slowest selection of phase velocities over a wide range of frequencies within a dispersion image. To extract or quantify the fundamental mode, an interpreted set of user-defined points is selected that represents the center line or midpoint of the fundamental mode’s peak amplitude within a dispersion image. The selected data points produce a graph of the fundamental mode’s unique features and characteristics, which reflect subsurface conditions.
When attempting to interpret dispersion curves, it is easy to select noise or other processing artifacts at low phase velocities mistakenly as part of the fundamental mode. Additionally, higher modes and harmonics can be misidentified as components of the fundamental mode. Although this may seem complex, high-quality and well-crafted dispersion images can minimize the confusion. Conversely, poor survey designs and inadequate fieldwork can result in subpar dispersion images, leaving you with lower quality results accompanied by a lack of certainty.
What is the inversion of the extracted fundamental mode?
An MASW seismic survey’s result is to create a subsurface model based on how the shear wave velocities differ at depth. While there is no unique solution, some models are more likely than others. To this end, a computer algorithm is used to produce the fundamental mode for a given inputted set of shear wave velocities based on depths or unit thicknesses.
The software uses this data to create a computer-generated fundamental mode. Subsequently, the computer generated fundamental mode results are compared to the interpreted extracted dispersion curves from dispersion images of the field data. If the computer generated and interpreted extracted curves do not agree very well, the cycle is repeated until one believes an acceptable match or agreement is reached. If the results are unsatisfactory, it could be because of either the choices made in interpreting and identifying the fundamental mode dispersion curve extraction were incorrect or there was not enough data available to form an acceptable dispersion image.
What is MASW or multi-channel analysis of surface waves
We have just discussed how to use the results from a MASW seismic survey to approximate shear wave velocities at depth. The next step is exploring ways of acquiring surface wave data. Prior to MASW, the widespread practice was utilizing one or two geophones for recording surface waves. The method was limited in that it only records one or two responses of the full wave field, leaving much more data to be captured. By utilizing an active source and multiple geophones that are positioned and assigned coordinates, the MASW method (Park et al., 1999a; Xia et al., 1999; Miller et al., 1999) took advantage of acquiring tens of seismic records (multi-channel) that capture how surface waves propagate over a larger area of concern.
Nowadays, seismographs with twelve or more channels are common and allow us to collect higher volumes of multiple-channel seismic records. With these datasets, we are able to create dispersion images and incorporate pattern recognition to enhance processing using wave field transformation. Hence, MASW has become a popular and reliable method for obtaining shear wave velocities at depths.
MASW field methods, data processing, and good practices
The wave field transformation techniques are extremely forgiving, as it can attenuate near-field and far-field effects along with minimizing spatial aliasing. As such, one does not necessarily have to adhere stringently to a defined set of rules when acquiring MASW seismic data. If you prefer to take the Do-It-Yourself route, here are a few common rules of thumb or ideas for acquiring MASW seismic data:
- a) To ensure a successful MASW survey, bring along a notebook to take detailed notes. It is essential that you record the exact location of each geophone and where the source or “shot point” is placed for every file number saved; if not, processing this data will be impossible.
- b) Finding the right active source can be tricky. A lighter weight sledgehammer, typically eight pounds or less for depths of ten to fifteen feet, will likely suffice. However, a sixteen, eighteen, or twenty-pound hammer is likely good when exploring less than seventy-five feet deep. Although, a twenty-pound sledgehammer withg multiple blows is likely needed for depths of 100 feet or more. When surveying greater than one hundred feet deep, it’s a good idea to stack active seismic data, collect multiple active records at each location, and/or collect active and passive 10 to 30 second MASW records. For greater depths, consider using an elastic wave generator (EWG).
- c) For the better results, use a twenty-four channel (or more) seismograph with stacking capabilities and record lengths of up to thirty seconds along with half-second sampling intervals. Above all, when collecting seismic data using a passive microtremor source, ten to thirty-second recordings is a necessity.
- d) For optimal results, ensure that you are aware of the maximum depth of penetration and horizontal resolution. We can assume you are already familiar with these quantities as we move forward in this conversation.
- e) As a rule of thumb, the length of a geophone array is about twice as long as the desired maximum depth of investigation. This doesn’t factor in any horizontal resolution needs that must be met. For instance, if you’re aiming to make a cross-section down to fifty feet with MASW, then the geophone array should be at least one hundred feet long. Extensively long arrays can prove problematic, but using too short of an array will quickly lead to lower levels of confidence.
- f) Since the length of the geophone array is typically twice the max depth of investigation, the geophone spacing is approximately the array length divided by the number of recording channels minus one. In other words, the maximum depth of penetration is approximately the number of geophones minus one multiplied by one-half the geophone spacing. For example, the geophone spacing for a depth of forty-six feet using a twenty-four channel system would be about 2*46ft/ (24 geophones-1) = 4 feet. Under some circumstances, the geophone spacing may need to be less than the above to avoid spatial aliasing or to meet horizontal resolution requirements. For a wide range of depths and horizontal resolution requirements, multiple array geometries may be required.
- g) Source offsets are known to range from about 0.1 to 0.5 times the maximum depth of penetration or 0.05 to 0.25 times the length of the geophone array. To accommodate both shallow and deeper responses, consider an offset distance of about ¼ the array length. From a practical logistic point of view, an operator will usually convert the distance to an integer multiple of the geophone spacing, which is about five or six times the geophone spacing for a twenty-four channel system. By conducting a walkout (graphic showing the entire seismic response starting with a zero offset) one may determine more optimum site-specific values for capturing the Rayleigh wave response.
- h) A single record using the above configuration produces a 1-D profile, with the inversion results representing the midpoint of the geophone array. If the goal is a 2-D cross-section or a 3-D presentation, the analysis requires additional records. For a 2-D survey, the geophone array and impact station (shot point) are advanced a predetermined distance. Depending on the application and level of detail, the array is commonly advanced one or more geophone spacings along a traverse between records. Many of the highest resolution MASW surveys advance one geophone spacing. Lower budget projects or bedrock surveys over spatially large areas may advance five to ten times the geophone spacing. Deciding on the distance to advance the array requires some special attention and considerable thought. Note that if the aim is to acquire a single 1-D profile, one should record additional records using a Vs30 1-D approach. This approach does not advance the geophone array but collects additional records with increasing offsets from both ends of the fixed geophone array. Again, take good field notes.
- i) While the bandwidth of 4.5 Hz geophones is often great enough for most MASW surveys. One may find for shallow investigations less than thirty feet deep, the data will produce better dispersion images with higher frequency geophones. On the other hand, attempting to reach depths greater than one hundred and fifty feet may benefit from lower frequency geophones, which are not always easy to find.
- j) For data processing, there are three basic areas. First, the MASW seismic records are reviewed for quality control and then entered into the software package with the necessary field geometry. Second, one conducts the dispersion analysis. Lastly, the dispersion analysis is inverted to produce shear wave velocities as a function of depth. Depending on the amount of data collected, the inverted results are plotted as 1-D, 2-D, or 3-D presentations.
What is ReMi
ReMi is an acronym for refraction microtremor. While a study could acquire multiple widely spaced ReMi data sets to create a 2-D presentation, it is not likely an efficient approach when compared to MASW. ReMi’s strong point is that it does not depend on an active source of surface wave energy. Pullammanappallil, Honjas, and Louie’s paper on the “Determination of 1-D Shear Wave Velocities Using the Refraction Microtremor Method” is a friendly guide for getting started. As with other passive microtremor methods, ReMi offers a fairly direct approach for 1-D profiles to depths over 100 feet. Some more robust studies have ventured to depths over 300 feet. In most cases, the deliverable product is a 1-D profile.
First, the ReMi method uses a geophone array that is up to three times the desired depth of investigation. Often, a multi-channel seismograph records five to ten passive source seismic records. Each unstacked record is frequently fifteen to thirty seconds long, using less than or equal to a two-millisecond sample interval. Since the method does not require precision timing of a source, in quiet areas, a field person can walk along the geophone array and hammer the ground with a sledgehammer and plate to create passive energy. Placement is not necessarily an issue. Processing is similar to MASW methods but uses other graphic techniques. ReMi creates a phase velocity spectrum to identify the lowest velocity envelope. Last, shear wave velocity modeling techniques produce 1-D depth profiles of shear wave velocities.
Concerns about MASW seismic methods and analysis
A user-friendly analysis of surface wave dispersion results depends on the phase velocity spectrum, revealing subsurface conditions. In other words, dispersion images must correlate or reflect conditions at depth in a pattern that humans can understand and interpret. While operators have a fair amount of control over data quality, some sites and subsurface conditions are not good record areas. That is, extreme surface conditions, poor density contrasts between units, and unreasonable target dimensions generate unmanageable dispersion images, images a person cannot reasonably interpret. Unlike conditions that are beyond our control, survey design and the level of effort put forth in the field are manageable. When designing a MASW seismic survey, it is essential to draw upon both the laws of physics and experience to create an optimal outcome.
1-D passive MASW seismic surveys are less demanding than 2-D or 3-D active MASW methods. However, active MASW methods generally offer greater lateral resolution, especially for shallow geophysical investigations. In most cases, passive remote microtremor surveys depend on the size and shape of a geophone array or pattern (e.g., square, circle, cross, or triangle). Moreover, greater depths imply spatially larger patterns. On the other hand, active surveys need to consider not only the depth of investigation but resolution requirements, array length, record or shot spacing, and potential aliasing. Given that active MASW surveys can adjust these factors, it also means that one has some control over the quality of a generated dispersion image. Poor survey design with passive or active applications will lead to dispersion images with poorly defined higher modes (blending of modes), contamination from unwanted signal(s), and/or near-field and far-field effects.
Innovations in MASW seismic surveys and analysis
This section is currently under review and should be available soon.
Why MASW seismic methods for geology, seismic site classification, voids, sinkholes, fill, and anomalies
1-D, 2-D, and 3-D MASW surveys with active, passive, and combined sources, methods, and applications

MASW seismic services, processing, equipment, rentals, and software

MASW case histories on mapping bedrock, mine reclamation, vibratory hammers

Special MASW content on theory, concepts, innovations, concerns, and credits

Contact MASWSeismic.com
Credits and references from around the world.
An apology goes out to those who are not listed and should be mentioned. No one is intentionally left out. Please understand, it would be difficult to include everyone who has contributed to this industry.
Bullen, K.E., 1963, An introduction to the theory of seismology, 3rd ed.; Cambridge University Press, London, 381 pp.
Dobrin, M.B., and Savit, C.H., 1988, Introduction to geophysical prospecting, 4th ed.: McGraw-Hill, Inc., New York, 867 pp.
Heisey, J. S., Stokoe II, K. H., and Meyer, A. H., 1982, Moduli of pavement systems from spectral analysis of surface waves: Transportation Research Record No. 852, 22-31.
Lunne, T., 1997, Cone penetration testing in geotechnical practice; Blackie Academic & Professional, London, 312 pp.
Miller, R.D., Xia, J., Park, C.B., and Ivanov, J., 1999, Multichannel analysis of surfaces waves to map bedrock: The Leading Edge, v. 18, no. 12.
i Park, C.B., 2005, MASW⎯Horizontal resolution in 2-D shear-wave velocity (Vs) mapping: Kansas Geological Survey, Open-file Report 2005-4.
Park, C.B., Miller, R.D., and Miura, H., 2002, Optimum field parameters of an MASW survey [Exp. Abs.]: SEG-J, Tokyo, May 22-23, 2002.
ii Park, C.B., Miller, R.D., and Xia, J., 2001, Offset and resolution of dispersion curve in multichannel analysis of surface waves (MASW): Proceedings of the SAGEEP 2001, Denver, Colorado, SSM-4.
iii Park, C.B., Miller, R.D., and Xia, J., 1999, Multi-channel analysis of surface waves (MASW): Geophysics, v. 64, no. 3, p. 800-808.
iv Park, C.B., Miller, R.D., and Xia, J., 1998a, Ground roll as a tool to image near-surface anomaly [Exp. Abs.]: Soc. Explor. Geophys., p. 874-877.
v Park, C.B., Miller, R.D., Xia, J., Hunter, J.A., and Harris, J.B., 1999b, Higher mode observation by the MASW method [Exp. Abs.]: Soc. Explor. Geophys., p. 524-527.
vi Park, C.B., Miller, R.D., and Xia, J., 1998b, Imaging dispersion curves of surface waves on multi-channel record [Exp. Abs.]: Soc. Explor. Geophys., p. 1377-1380.
vii Park, C.B., Miller, R.D., and Xia, J., 1996, Multi-channel analysis of surface waves using Vibroseis (MASWV) [Exp. Abs.]: Soc. Explor. Geophys., p. 68-71.
Richart, F.E., Hall, J.R., and Woods, R.D., 1970, Vibrations of soils and foundations: Prentice-Hall, Inc., 414 pp.
Satish Pullammanappallil, William Honjas, and John N. Louie, Determination of 1-D Shear Wave Velocities Using the Refraction Microtremor Method, From the Internet.
Sheriff, R.E., and Geldart, L.P., 1982, Exploration seismology, volume 1: Cambridge University Press, 253 pp.
Stokoe II, K. H., Wright, S.G., Bay, J.A., and Roesset, J.M., 1994, Characterization of geotechnical sites by SASW method, in Geophysical characterization of sites, ISSMFE Technical Committee #10, edited by R.D. Woods, Oxford Publishers, New Delhi.
Telford, W.M., Geldart, L.P., Sheriff, R.E., and Keys, D.A., 1976, Applied Geophysics, Cambridge University Press, Cambridge, 860 pp.
Tokimatsu, K., Tamura, S., and Kojima, H., 1992, Effects of multiple modes on surface wave dispersion characteristics: Journal of Geotechnical Engineering, American Society of Civil Engineering, v. 118, no. 10, p. 1529-1543.
Xia, J., Miller, R.D., and Park, C.B., 1999, Estimation of near-surface shear-wave velocity by inversion of surface waves: Geophysics, v. 64, no. 3, p. 691-700.