Case histories demonstrate reasons for using multi-channel analysis of surface waves
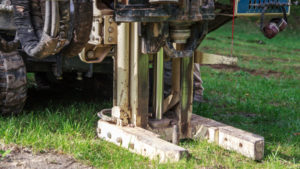
By employing multi-channel analysis of surface waves methods, it is possible to detect sinkholes, map bedrock valleys, assist with the design of solar and wind farms, identify phosphatic clays or slime pits typically associated with phosphate mining operations, as well as map bedrock topography. In two case studies that illustrate the effectiveness of such methods, the operator used a vibratory hammer as a seismic source for mapping bedrock, which successfully identified areas of concern to depths up to 50 feet in depth.
During these case histories, a gas-powered commercial vibratory hammer attained comparable outcomes to those of a 10lb sledgehammer. ParkSeis’ ability to operate and examine both passive and active seismic sources in unison – combined surveys – often yields the most successful MASW results. With the exception of one case history, all the MASW examples are a result of active and passive survey data. Please be advised that certain graphics have been customized specifically to safeguard customers’ privacy.
Case history for engineered solar farm design integrating MASW depth to bedrock results
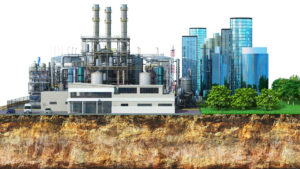
When constructing a solar farm, the foundations, posts, and pads must be tailored to fit each specific site. This means that material costs are largely determined by local geology. If there is reasonably shallow rock, it can provide a good foundation for posts or pilings to rest on. However, if the bedrock is too shallow, it could pose a challenge for securing the posts or pilings in bedrock to prevent them from tipping. Additionally, if the soil is more plastic or poorly compressed, one may need to use pads in the design to ensure that the installation gets the necessary support. Fortunately, multi-channel analysis of surface waves surveys help improve engineering design while simultaneously reducing expenses – ultimately providing cost savings for clients!
Multi-channel analysis of surface waves case history details for an engineered solar farm design.
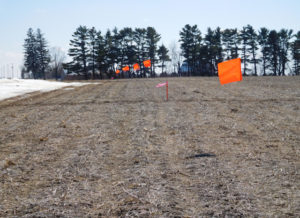
To acquire data, we employed a Geometrics 24 channel Geode with 24 geophones fastened to a land streamer, spaced 2ft apart, with a 12ft shot offset. The operator set the record spacing to 20ft and stacked three one-second-long records with a 10lb sledgehammer and plate for each active MASW record. Besides laying out evenly spaced lines on a grid for the MASW survey, GPS technology was used to map site features.
MASW results map depth to bedrock
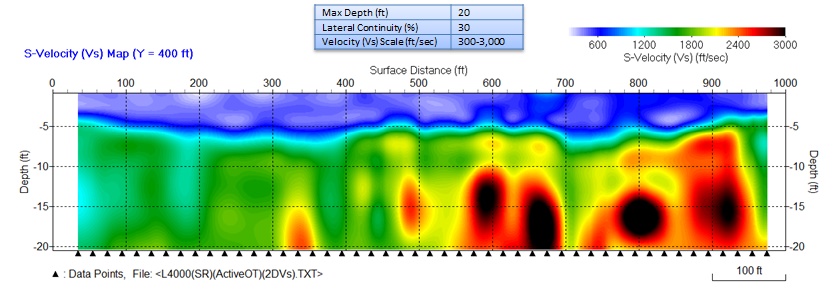
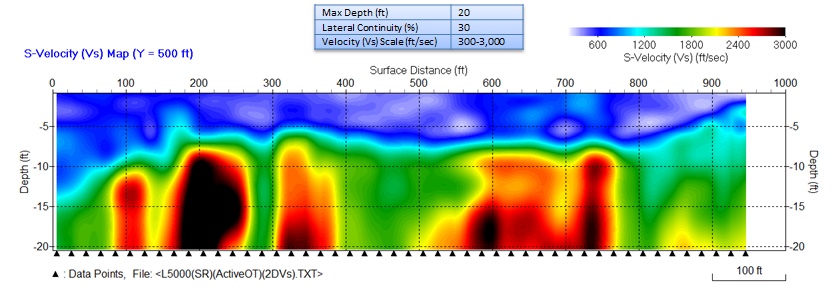
We can observe two of the many MASW lines that were acquired in Figure 1 and 2. An interpretation of Figure 1 reveals that the depth of soil or bedrock is roughly 5ft deep. The portions shaded red convey much higher shear wave velocities than other sections across the lines. The results show that some of the slowest bedrock velocities are between 30ft and 240ft along the line. These regions are highlighted in a light blue color to represent their potential for being more weathered than other areas shown by the transition from green to yellow and, finally, red. Therefore, these light blue zones hold the greatest likelihood of increased weathering. In contrast to the results of Figure 1, those from Figure 2 may be a concern. An interpretation of the results between 0ft and 200ft along the line in Figure 2 implies dipping bedrock. The deepest point is located near the start of the line at 0ft; hence, pilings at this location might have to be longer than what was necessary in Figure 1 – a possible increase in project expenses.
Geophysical methods for mapping a bedrock valley and weathered rock
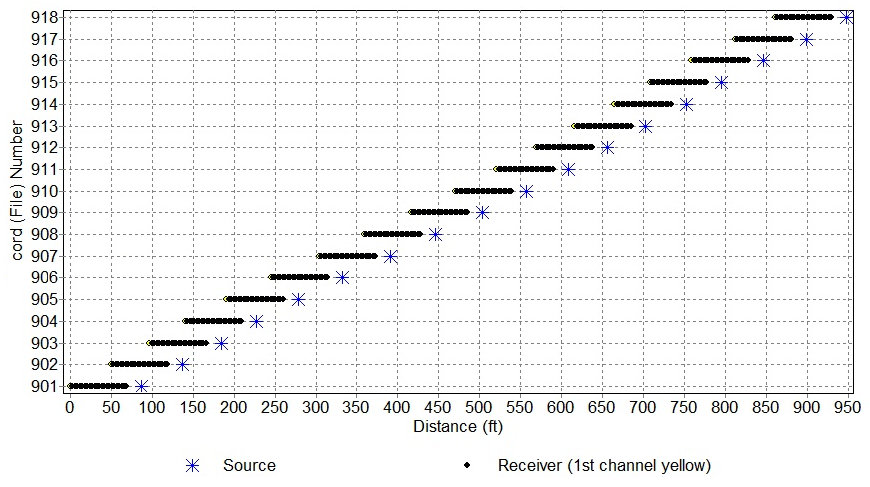
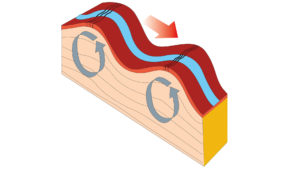
Multi-channel analysis of surface waves provides a method for identifying bedrock valleys, which frequently correlates well to zones of preferential groundwater flow. Moreover, the degree of weathering in such areas is often more pronounced because of its topography. Sometimes valley floors become more deeply weathered due to faulting and large-scale joint systems. MASW helps identify these areas, which may aid in directing groundwater flow, as well as map out differences in the bedrock surface’s elevation. The case history is notable because site conditions did not permit a fixed distance between records, which demonstrates the flexibility of survey design with MASW. The distance between records ranged from 40ft to 60ft, as shown in the source-receiver chart.
MASW survey details for mapping shallow bedrock valleys and weathered rock.
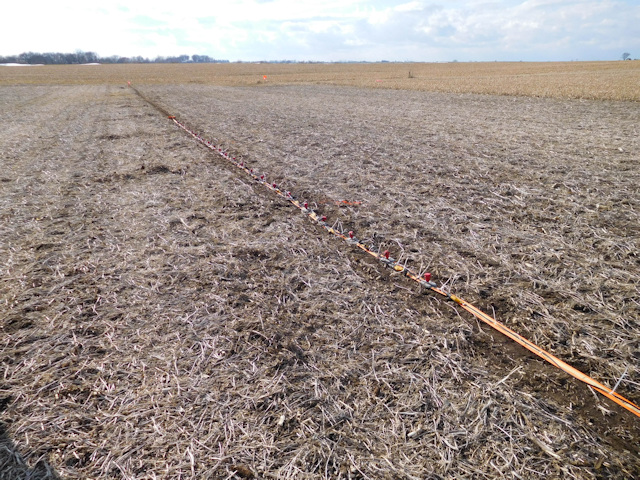
Data acquisition utilized a Geometrics 24 channel Geode, 24x14Hz geophones fastened to a land streamer, 3ft geophone separation, uneven shot offset ranged between 40ft and 60ft, and a record spacing of 18ft. One 5 second long record recorded multiple hammer strikes using a 10lb sledge hammer and plate to produce a combined active and passive MASW record. GPS was used to map site features and to layout a grid pattern.
MASW maps a bedrock valley for the potential of more highly weathered rock
This case history involved mapping a small bedrock valley and indications of differential weathering that could create pathways for groundwater flow. Additionally, it highlighted the ease of processing unevenly spaced records using ParkSeis. To determine the distances between records or shot points, sub-meter GPS was used after acquiring the data.
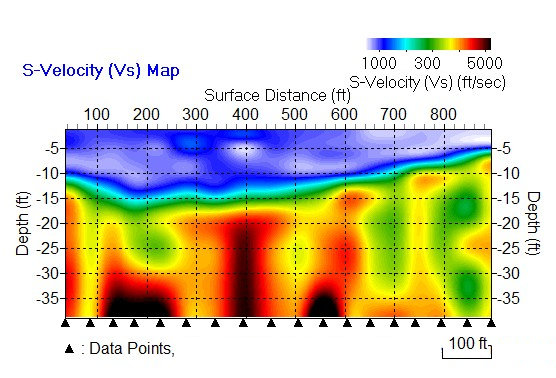
These MASW case history results indicate that the soil is thickest, or the bedrock is deepest, between 100ft and 300ft along the line. Furthermore, at a distance of 200ft along the line, there appears to be a low-velocity zone within the bedrock at a depth of approximately 25ft. This particular zone is thought to be an area of significance where the weathering is more intense, as suggested by the lower velocities shaded green. Using electrical resistivity imaging (ERI) and electromagnetic methods is commonly successful for bedrock surveys. However, in this case history, a layer of sand and gravel was present within the soil unit, which affected the accuracy of ERI and EM results. The ERI method sometimes gave a shallower depth to bedrock than what was present. On the other hand, the sand and gravel layer did not affect the results of the MASW method. The MASW results turned out to be similar to the results obtained from the Geoprobe direct push results.
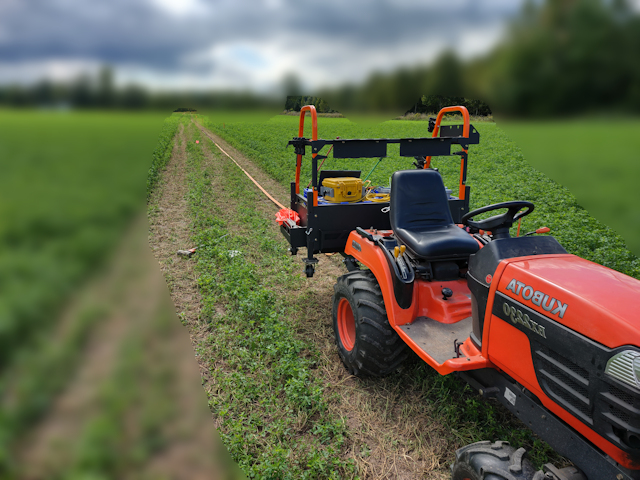
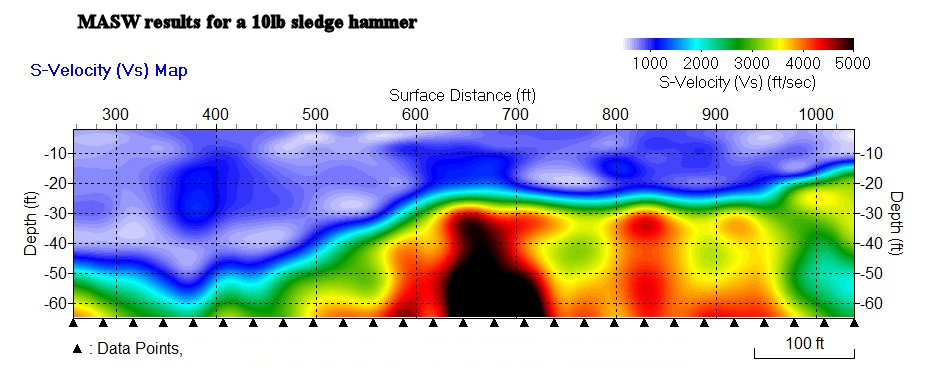
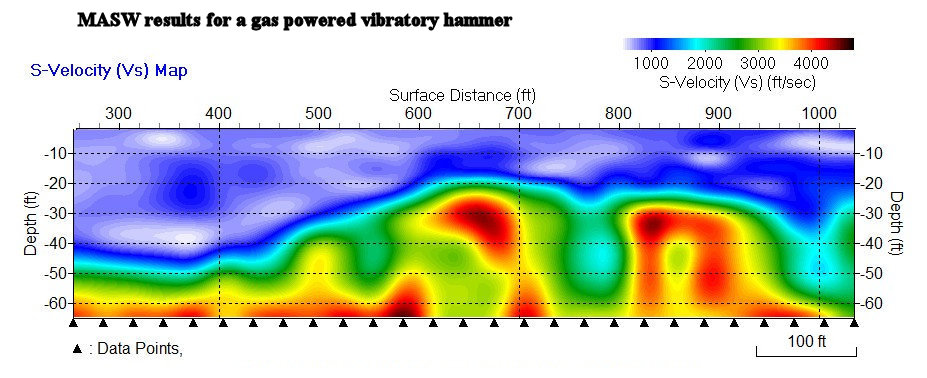
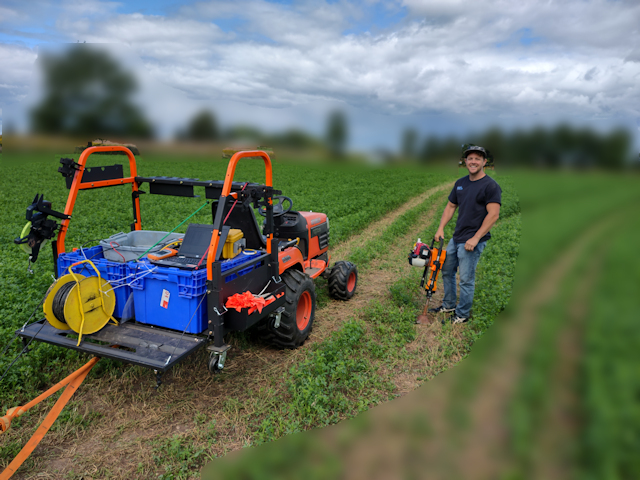
A comparison of 50ft deep MASW results from a vibratory hammer source and a 10lb sledge hammer
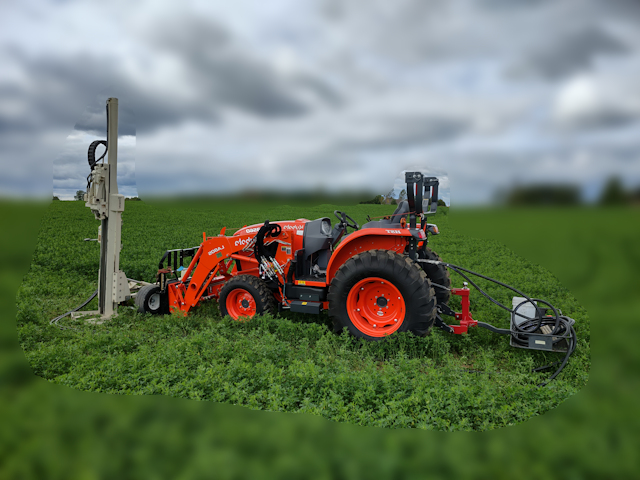
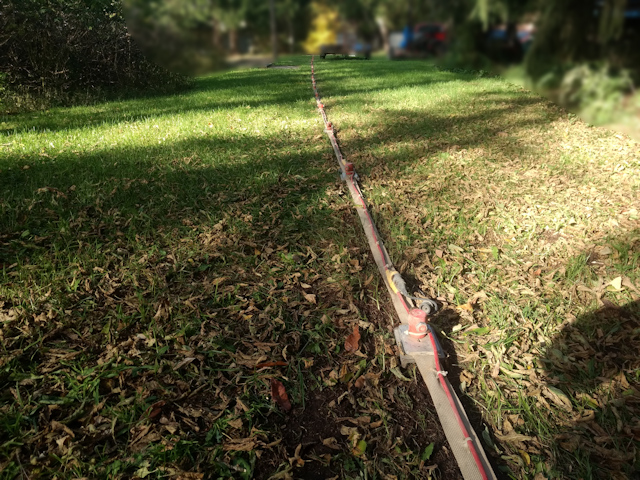
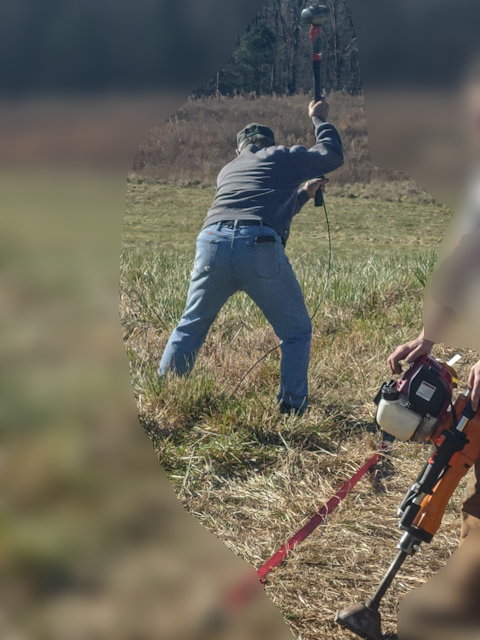
Professionals such as geophysicists and engineers are frequently searching for improved seismic energy sources. Before MASW, the primary emphasis has been on developing improved devices that generate powerful P-wave energy for conducting refraction and reflection surveys.These seismic methods rely on producing very little ground roll or surface waves. Today, a variety of surface wave sources are used to create high-quality Rayleigh waves that cover a wide range of wavelengths and frequencies. When conducting MASW surveys for depths less than 100 feet, a crew may choose a 20lb sledgehammer and plate. Swinging this monster hammer can limit a team’s ability to collect data in a day due to its physical demands. One solution to reduce the physical demands of the operator is to use gas or electric powered mechanical devices. Tests have been conducted, including this case history, to determine if gas powered vibratory hammers designed to drive metal posts are practical.
The results of this case history were positive and showed that these vibratory hammers can quickly and efficiently produce quality Rayleigh waves with less physical effort by the operator. In general, vibratory surface wave sources are less likely to cause severe damage when compared to using a 20lb sledgehammer, which typically requires five to ten very high-impact blows. However, it should be noted that the vibratory surface wave sources weigh more than a 20lb sledgehammer but do not need to be swung over a operator’s head. One person can manage this source with little difficulty. Despite the lower impact, they can produce up to 30 blows per second. Gas or electric powered mechanical devices can make MASW surveys more efficient and cost effective, while also minimizing damage and soil disturbance. Using these devices can reduce physical effort and increase productivity, resulting in improved data quality in both shallow and deep surveys.
MASW survey details for comparing a vibratory source and a 10lb sledge hammer.
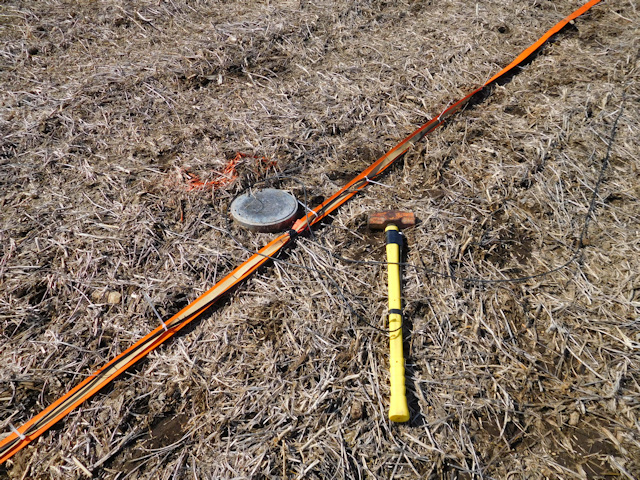
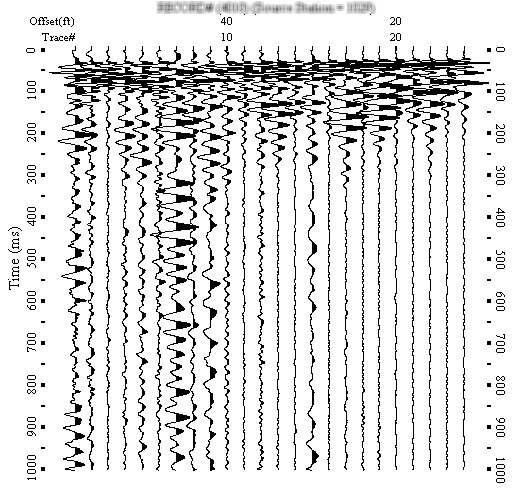
Data acquisition used a Geometrics 24 channel Geode, 24×4.5 Hz geophones fastened to a land streamer, 5ft geophone separation, 30ft shot offset, and a record spacing of 30ft. The survey recorded two records per location, see figures. The first of two records acquired multiple strikes over a 5-second period with a 10lb sledge hammer and plate. The second record used a variable speed gas powered vibratory post driver. Both sources produced a seismic record that combined active and passive energy. GPS was used to document the locations of the MASW records.
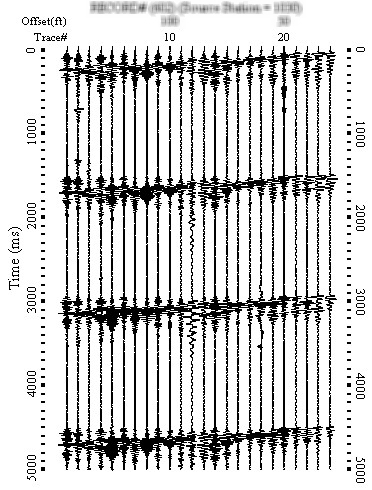
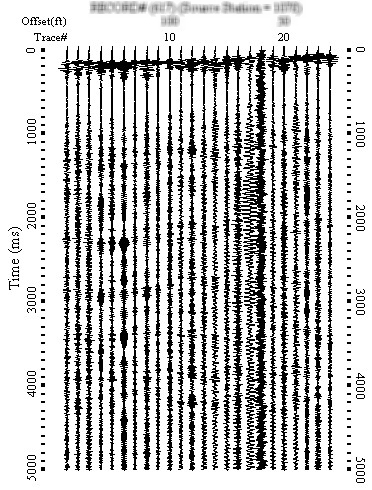
MASW results to compare 50ft deep MASW results from a vibratory source and a 10lb sledge hammer
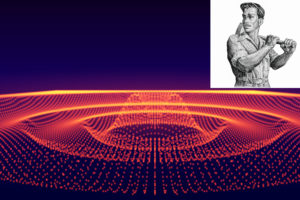
MASW uses an active seismic source with a well-defined pulse to produce quality dispersion images. Unlike seismic refraction or reflection, which display data in the time domain, MASW presents results in the frequency domain. It was later theorized that combining active and passive energy sources during a single record could be beneficial. This led to the development of the ParkSeis MASW processing software, which allows the integration of active and passive seismic energy in a combined survey. Dr. Choon Park discovered that using an active source (such as the first impact of a sledgehammer) along with passive energy (from subsequent blows with a sledgehammer or vibratory hammer) often produces better dispersion images with greater bandwidth.
Although the software was first designed to utilize passive energy sources like road noise and nearby naturally produced Rayleigh waves, he realized it could also potentially incorporate and take advantage of passive energy produced by an active energy source, like random sledgehammer blows. The case history shows that a survey that combined active and passive energy was helpful. It also showed that a gas powered vibratory hammer could achieve results similar to a 10lb sledge hammer and plate, for depths of less than 50ft. While the data from both methods did not give the same results, this was probably due to non-uniqueness issues. Regardless, the results showed a strong correlation.
Geophysical case history characterizing reclaimed phosphate mines in Florida
Phosphate mining began prior to 1900 and has caused significant changes to both the surface and subsurface of many areas in Florida over the past 120 years. As demand for housing increases, land that was previously considered unsuitable for development could now be valuable real estate. A geophysical investigation used MASW methods to map the boundaries of disturbed soils and phosphatic clays (also known as slime). The phosphatic clays are part of the waste clay that has very fine grains and high porosity. It is generally saturated and has low hydraulic conductivity. Waste clay is not generally viable for building, farming, agriculture, or recreation until it has undergone treatment.
MASW survey details for characterizing reclaimed phosphate mines in Florida.
Data acquisition used a Geometrics 24 channel Geode, 24x14Hz geophones fastened to a land streamer, 5ft geophone separation, 30ft shot offset, and a 5ft record spacing. Two records were recorded at each shot point, which were later combined during post-processing. The first of the two records acquired multiple strikes over a 5-second period with a 10lb sledgehammer and plate. The initial impact of the sledgehammer started the second record before energizing a vibratory post driver. Both sources produced a seismic record that combined active and passive energy. GPS was used to map the path of the MASW array.
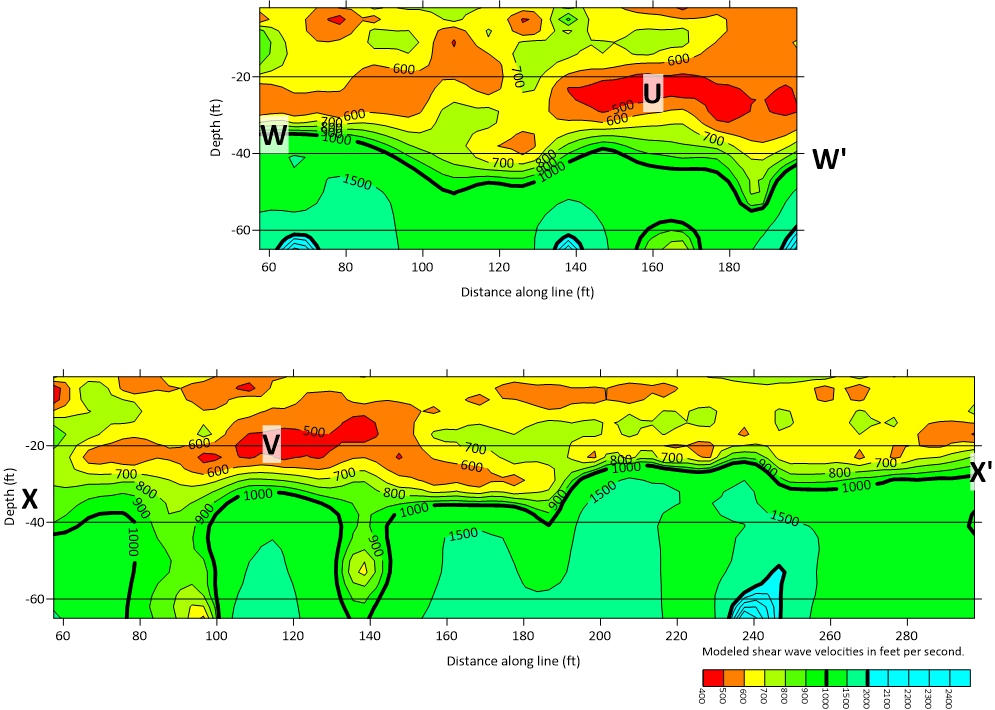
MASW case history-mapping phosphatic clay left during reclamation of a phosphate mine in Florida.
An interpretation of this MASW case history suggests that, more or less, 30ft of soil covers the limestone bedrock. The bedrock surface increases in depth from section W-W’ towards section X-X’. Zones of lower velocity below the limestone bedrock surface suggest the potential for karst and epikarst activity. As for the soils, areas not dominated by phosphatic clay waste are interpreted to have a range of shear wave velocities or Vs between 600 ft/s and 1000 ft/s. Areas interpreted as potential deposits of clay waste appear to yield Vs of less than about 600 ft/s and are labeled U and V. The nearby drillers’ logs corroborated this interpretation.
MASW for mapping and defining sinkholes
Karst or epikarst activity that leads to the development of a sinkhole is a serious matter. A suite of geophysical methods (MASW, EM31, and electrical resistivity imaging) were integrated to detect, confirm, and delineate sinkholes and phosphatic clay over an approximately 40-acre site. Unlike an MASW seismic survey, electrical resistivity imaging, GPR, and EM methods respond to pore fluids (e.g., groundwater and contamination). In cases where pore fluids may affect one or more of the geophysical methods, MASW may be a better choice. As we all know by now, MASW surveys use Rayleigh waves to detect void spaces. Like air, fluids are not rigid. Therefore, in an MASW survey, a detectable void will have a similar appearance whether or not it is filled with fluid. MASW is one of the few methods that can confirm and define a sinkhole without being affected by groundwater.
MASW case history details for mapping and defining sinkholes
Data acquisition utilized a Geometrics 24 channel Geode, 24x14Hz geophones fastened to a land streamer, 3ft geophone separation, 18ft shot offset, and a 6ft record spacing. Two records were recorded at each shot point, which were later combined during post-processing. The first of the two records acquired multiple strikes over a 5-second period with a 10lb sledgehammer and plate. The second record was triggered using the sledgehammer just before energizing a vibratory post driver. Both sources produced a seismic record that combined active and passive energy. GPS was used to map the path of the MASW array, which followed a curved path.
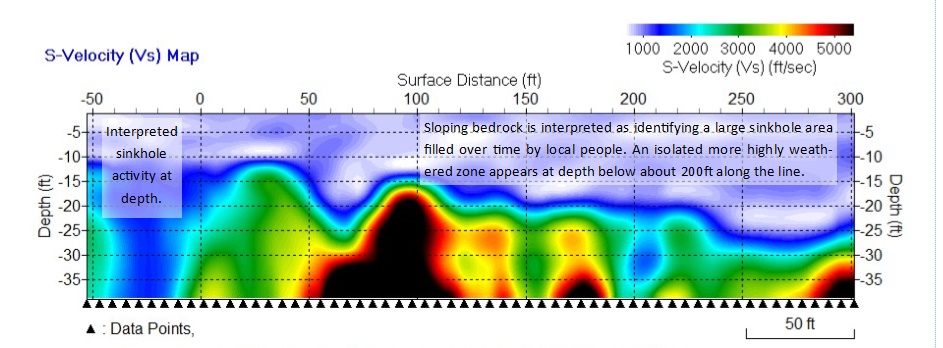
MASW case history maps sinkholes
Sinkholes and epikarst activity were observed near -25ft and between 150ft and 300ft on the MASW line. Many believe that the sloping bedrock indicates a spatially large sinkhole area that was filled over time by the local community. Further analysis revealed an isolated zone with greater weathering below about 200ft along the line. The path of the MASW survey line was not straight. It was intentionally curved so that it could intersect with more suspect areas that were detected by the EM survey. Although the records were collected along a curved path using the MASW method, the land streamer array was positioned to align with the shot point location and generally tangential to the curve. The boreholes have confirmed that the geophysical interpretation was accurate in detecting and locating significant and risky karst activity, which led to the formation of sinkholes.
Summary of case histories on multi-channel analysis of surface waves (MASW) and its applications
Implementing Multi-Channel Analysis of Surface Waves (MASW) techniques is proven to be a highly effective approach for detecting sinkholes, mapping bedrock valleys, and supporting the design of renewable energy facilities, such as solar and wind farms. Moreover, MASW can accurately identify phosphatic clays or slime pits, which are commonly found in phosphate mining operations. Additionally, this method allows for the mapping of bedrock topography, providing detailed information about the subterranean.
As featured in two successful case studies, the MASW process utilized a vibratory hammer as a seismic source to map bedrock formations. It effectively revealed problematic areas up to 50 feet deep, demonstrating its high level of accuracy and reliability. These findings provide significant insights into the potential of MASW as a robust geophysical mapping technique for a wide range of applications, from mining operations to renewable energy projects and beyond. In conclusion, the Multi-Channel Analysis of Surface Waves (MASW) technique is a highly effective approach for mapping bedrock formations and identifying problematic areas. Its potential applications are vast and range from supporting mine reclamation efforts to optimizing renewable energy project design. As such, it is a valuable tool for a wide range of industries and applications.
Why MASW seismic methods for geology, seismic site classification, voids, sinkholes, fill, and anomalies
1-D, 2-D, and 3-D MASW surveys with active, passive, and combined sources, methods, and applications

MASW seismic services, processing, equipment, rentals, and software
MASW case histories on mapping bedrock, mine reclamation, vibratory hammers

Special MASW content on theory, concepts, innovations, concerns, and credits
Contact MASWSeismic.com