1-D, 2-D, and 3-D MASW surveys with active, passive, and combined sources, methods, and applications
MASW seismic surveys are a type of geophysical investigation used to map subsurface features. Such surveys are typically composed of one-dimensional (1-D), two-dimensional (2-D), and three-dimensional (3-D) data sets that can be conducted by utilizing both active and/or passive sources. Active MASW seismic surveys involve the generation of Rayleigh waves by artificially creating seismic energy, such as a sledgehammer and plate, vibrator, or other types of impulsive source devices. Passive MASW seismic surveys use Rayleigh wave energy from ambient noise or natural sources (e.g., wind, traffic, construction, and ocean waves) and surface waves created by unplanned human activities.
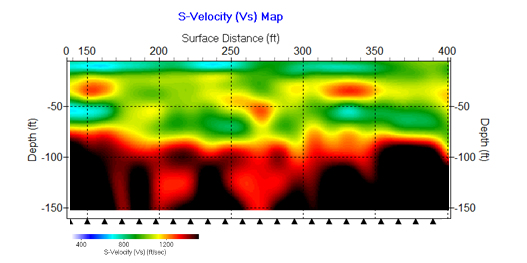
1-D MASW seismic surveys are like borehole results in that they only identify what is occurring at a specific location and nothing beyond that point. Results from 1-D MASW surveys are presented as shear wave velocity profiles. 2-D MASW seismic surveys are used to map the subsurface in cross-section, for example, geotechnical engineering projects and shallow hydrological studies. The data acquired from the 3-D MASW survey can create a shear wave velocity contour map or 3-D models. Combining multiple closely spaced 2-D MASW seismic lines can lead to 3-D shear wave velocity models or tomogram. In other words, tomograms are typically generated from 2-D data sets that are acquired from multiple MASW surveys, then interpolated into a 3-D model. 3-D MASW seismic surveys may provide more detail of the subsurface. Without doubt, robust data sets have several options, they can be presented as an isosurface map, shear wave velocity tomogram, or other types of 3-D data visualization methods.
Active, passive microtremor, and combined active-passive sources of Rayleigh waves
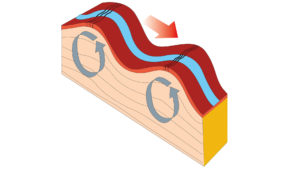
Rayleigh waves are a form of seismic energy that can originate from either active or passive sources. Active sources involve the deliberate introduction of seismic energy, such as when field personnel use a sledgehammer and plate to generate vibrations in the earth. Passive sources occur naturally and by random human events. Passive sources include everyday human activities and events that occur in nature; examples include, traffic, trains, construction activities, wind, changes in tidal wave motion, weather, and other sources associated with human activities not invoked by field personnel.
For data acquisition purposes, one may choose to use either an active or passive source of Rayleigh wave energy. Active sources provide a higher level of control and can generally yield higher resolution results near the surface than passive sources. When an active source is inaccessible or cannot reach the desired depths, passive sources are commonly used. Then again, a combination of active and passive sources is also possible. In this case, the initial impact from the active source will start the recording process, while passive sources provide additional data content. This process is known as combined active-passive sources of Rayleigh waves. This technique can be useful for providing more detailed and reliable MASW data than either active or passive sources alone. By using both active and passive sources in combination dispersion images are often easier to interpret, which decreases the time and cost involved in post-processing.
Active sources of Rayleigh waves
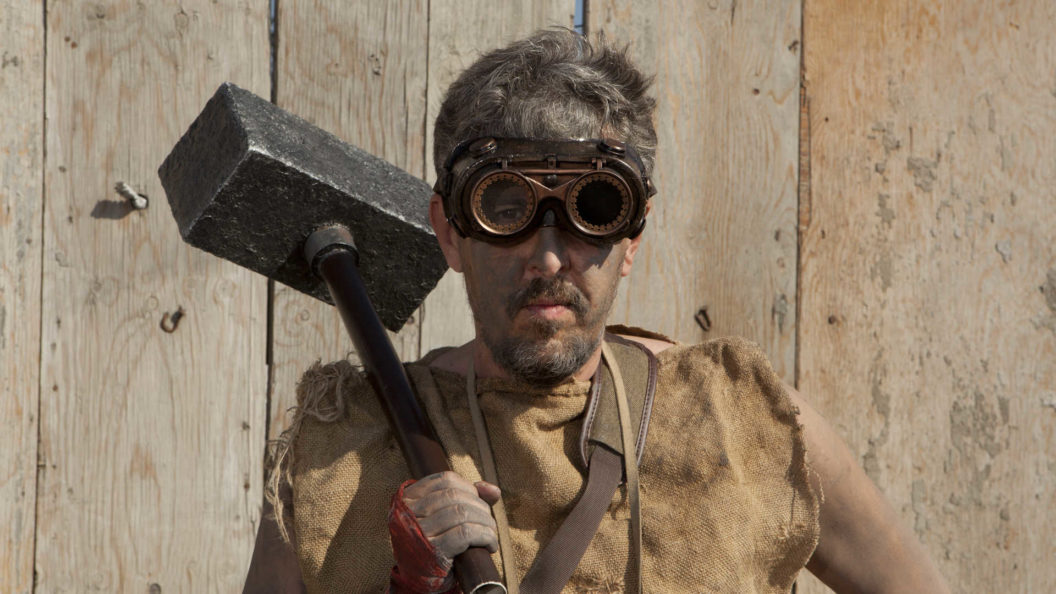
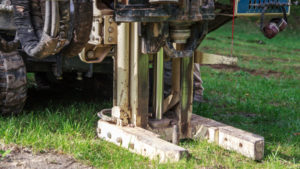
According to Dr. Choon Park, an active source is one that meets three specific criteria. First, instrumentation must accurately detect the start time of a seismic event. That is to say, one must rely on tools such as a trigger switch attached to the seismograph. This combination can detect the point of impact with an accuracy down to ten-thousandths of second, which allows one to combine or stack multiple impacts. Secondly, the field geometry is pre-determined and well-documented. To put it another way, the operator must know exactly where the point of contact is located with respect to the array or placement of geophones. Lastly, the operator can typically adjust and monitor the level of energy produced by the source. Without the use of seismic charges, active sources are, more or less, restricted to sledgehammers and plates, elastic wave generators (EWG), propelled energy generators (PEG), or Gisco seismic sources. Although active sources provide lower power levels than passive sources, which can cover long distances, they are repeatable and stackable.
Understanding when and where the impact occurred lends itself to improved post-processing, thus creating better results. By adjusting the geophone spacing and positioning of the seismic source, operators can maximize survey design, which enhances both the accuracy and resolution of MASW seismic surveys. While it is possible to increase the depth and resolution of an active survey by combing records from additional active shots, it is difficult to attain the greater depths achieved from the seismic energy acquired using passive microtremor sources (note: passive sources often lack the higher frequencies needed to yield higher resolution results). Last, by controlling the specifications of the impact source, you can tailor it to your specific objective. For instance, if you want to conduct a MASW seismic survey to reach a depth of 10 feet, then it would be unwise to acquire multiple blows from a 20-pound sledgehammer close to the array of geophones. Too much energy generated by such an approach would likely overload the geophones. At the same time, an 8-pound sledgehammer would likely generate a more satisfactory outcome.
Passive microtremor sources of Rayleigh waves
Passive microtremor sources are different than active sources because they are missing one or more active source requirements (timing, known positioning, and size). Moreover, naturally occurring passive microtremor sources are generally lower frequency with longer wavelengths. Comparing naturally occurring passive energy from environmental or geological events to the passive energy from human activities’ reveals another distinctive difference: the Rayleigh waves generated by human activities are, more or less, higher frequency with shorter wavelengths (yet, frequencies are generally not as high as those from an active source). To clarify, the earth has the potential to produce immense long-distance waves that traverse thousands of miles. The earth’s crust behaves like a low pass filter which impedes higher frequencies and shorter wavelength energy from propagating great distances. In contrast, human activities such as vehicle traffic (including cars, trains, or jets), construction works, or manufacturing plants occur nearer to the survey site and typically consist of seismic energy that is shorter wavelength and higher frequency, sometimes up to 200 Hz–as recorded by ground vibration monitors.
Note that Rayleigh waves generated by an active source may not have any immediate benefits if they are processed with only passive techniques. Nevertheless, when it is impossible to control the configuration or layout of a survey or its timing and you only need rudimentary one-dimensional data, sledgehammer/plate combinations, weight drops (e.g., elastic wave generator [EWG], Gisco seismic source), or heavy class vibrators can be employed for passive surveying purposes. In these situations, each seismic record often requires a minimum of ten seconds recording time. This method tries to capture low-frequency Rayleigh waves that aid in understanding deeper subsurface structures. To enhance the shallow section of the data set, technicians can use a sledgehammer and plate (without a trigger or specific location) to create passive energy while conducting the long recordings. Furthermore, MASW surveys targeting depths greater than one hundred feet may rely on passive sources alongside active sources – this is when we delve into MASW seismic surveys combining both active and passive techniques.
Combined sources of Rayleigh waves
MASW seismic surveys provide unparalleled results when utilizing both active and passive energy sources, a task that might have been impossible without ParkSeis’s integrated approach. This type of survey is valuable for two main reasons. To start, an optimized survey design with an active source may not always be able to capture high-quality Rayleigh wave data for the desired depths. In this instance, passive sources can supplement MASW surveys, improving dispersion images. Secondly, analyzing passive source Rayleigh wave data processed without active source energy strengthens your confidence when interpreting results. There are times when it’s challenging to accurately identify the fundamental mode or interpret a dispersion image correctly without passive source data. An additional comparison of both sets of data gives an alternate perspective that helps build confidence and provides more comprehensive insights, especially for deeper layers.
Types of analysis or presentations using Rayleigh wave results
Without doubt, the goal is to produce MASW derived shear wave vertical velocity profiles that agree well with true conditions. As is generally the case with geophysical methods, MASW results are not unique. The MASW process works towards creating models that generate dispersion images similar to those generated from the field data. Thus, the correlation of MASW results to actual conditions is often directly related to how the MASW seismic survey was designed and implemented. Depending on the level of confidence, there are several levels of effort at one’s disposal. Again, one should be aware that no level of effort can overcome the problem of non-uniqueness. Greater levels of confidence come with greater levels of effort. Acquiring more MASW is better than less.
So far, we have discussed Rayleigh wave sources and their effect on seismic surveys. Now, let’s investigate how we can display the collected data in a variety of ways. For example, if you are looking for a broad understanding of the material stiffness at depth for an earthquake response, then one-dimensional MASW seismic surveys for Vs 30m or Vs 100ft would be an appropriate option. On the other hand, if your intent is to define the boundaries of an over grown ash pit, two-dimensional or three-dimensional methods would likely be a better choice. One would soon find that acquiring the necessary detail to map variations across an extensive area would be expensive with only 1-D methods. In comparison, a 2-D/3-D MASW seismic survey with a towed geophone array would produce geological models of soils and/or rock for far less cost. Thus, one should always consider 2-D and 3-D MASW surveys. To create a 2-D representation, one simply acquires data to produce tens if not hundreds of dispersion images along a line, which can then create a cross-section. In comparison, 2-D/3-D surveys combine numerous closely spaced 2-D parallel lines of data and merge them to generate a 3-D picture (tomography). Although genuine 3-D surveys are infrequent, this process uses geophones distributed on a 2-D grid that provides 3-D depictions.
Background on Rayleigh wave analysis
Since the 1950’s, there has been a fascination with using surface waves to characterize the subsurface. Early work started with moving a single geophone. The research advanced to two geophones, which gave birth to the method known as spectral analysis of surface waves or SASW. In less than twenty years after SASW, Park and others demonstrated the benefit of using many geophones or multiple channels (multi-channel). Today, we have a range of methods that use a single three-component geophone for horizontal-to-vertical spectral ratio or HVSR surveys to more than twenty-four geophones per record with MASW. Thus, one has a variety of ways to analyze surface waves. Rayleigh waves are one flavor of surface waves that are straightforward to generate and are satisfactory for dispersion analysis. A variety of methods (MASW, SASW, ReMI, and HVSR) are outlined below that may suit your needs.
1-D Rayleigh wave analysis for earthquake design or general foundation studies
Earthquake seismic site classification (Vs30m or Vs100ft) and foundation studies rely heavily on the average shear wave velocities obtained from a surface wave survey. These disciplines are not typically concerned with obtaining 2-D or 2-D representations of the subsurface but rather focus on using an estimation of the average shear wave velocity for the top thirty meters or one hundred feet. When we talk about 1-D, it indicates that data is being gathered from beneath a single surface point. This concept is analogous to soundings in electrical methods. For higher levels of confidence, one should consider executing 1-D measurements with twenty-four or more geophones using the MASW approach. If the number of geophones is reduced, then it would be essential to collect many more seismic records at different offsets.
When assessing seismic sources, one factor to consider is size. In comparison to many MASW surveys that only need data from depths of 70ft or less to produce 2-D cross-sections, Vs30m and Vs100ft site classification surveys require a response down to 100ft deep or more; thus requiring more seismic energy. To generate longer deeper penetrating surface waves, consider employing a 20-lb sledge hammer and plate or weight drop. To obtain more reliable data, consider recording 10-30 second records with multiple blows of the sledgehammer. ParkSeis’ active/passive algorithms maximize the potential of utilizing both active and passive sources for deep surveys.
More about 1-D multi-channel analysis of surface waves or MASW
The approach for the multi-channel analysis of surface waves at a single location uses a spatially well-defined array of geophones and an active source. At times, the operator will supplement the active source data with passive Rayleigh wave records. Enhancing the active source records improves the depth of penetration and level of confidence. While an active source is a deterrent to some, there seems to be some consensus that the active MASW approach yields better-defined dispersion images. Better dispersion images lead to better choices when interpreting the placement of the fundamental mode. Many find that 1-D MASW and refraction microtremor (ReMi) methods are interchangeable for Vs30 and seismic site classification studies. Frequently, a choice comes down to personal preference, level of experience, and site conditions.
With a bit of extra effort, the MASW technique yields more rewarding results; it produces a two-dimensional cross-section that may be beneficial when making informed decisions. The MASW process usually uses an array length that is double the depth of investigation. Depending on the methodology employed for data acquisition, an MASW array may be shorter than what is necessary to achieve successful results with the ReMi technique. An operator collecting 1-D MASW seismic records has a choice of using active or a combination of active and passive microtremor energy sources. Because MASW uses an active source (a timed or triggered source) it is very common to stack records or combine multiple active records from the same location. For example, using a sledgehammer a field operator strikes a plate and stores a desirable record. A hammerman strikes the plate again to create a second record. If the response is acceptable, the operator either combines the first and second records or saves them separately to be stacked during post processing. This process continues until the operator feels the combined data represents a well-defined Rayleigh wave response with a minimal amount of noise from unwanted sources. Utilizing a combined active/passive 1-D survey, it is found that recording 10 – 30 second records initiated with a single hammer strike and supplemented by consecutive blows during the longer period leads to greater bandwidth within the dispersion images as well as an increased range of frequencies.
More about Refraction microtremor or ReMi analysis
When performing 1-D MASW seismic surveys, both the MASW and ReMi methods yield similar output for foundation analysis as well as determining Vs30 (Vs100ft) seismic site classification but possess several key differences. Like MASW, the ReMi method uses an array or group of geophones along a line. In contrast to MASW, ReMi does not require an active source or an impact source (e.g. sledgehammer, weight drop, or elastic wave generator) that triggers the seismograph. Instead, the ReMi depends on passive microtremors. However, microtremor seismic records are sometimes supplemented with an impact source that is not timed. It is easy to collect ReMi data using this method. On the other hand, studies found some have difficulties in picking the optimum dispersion curve with the method. Unlike MASW, ReMi is not likely an efficient approach for producing 2-D cross-sections. Thus, the final product is frequently a 1-D presentation, like a boring log.
ReMi offers some other distinct advantages and disadvantages. Advantages are that common refraction seismic instrumentation (like MASW) is used, a seismic source is not a requirement, geophones do not need accurate placement along the array, and the method is appropriate for greater depths of penetration. The advantages require some clarification. First, I find that ReMi suggests the length of the geophone array is up to about three times the depth of penetration, which is somewhat uncommon for refraction. In other words, a standard refraction cable setup for the same depth may not be acceptable for a ReMi survey. Second, the ReMi method depends on passive microtremors. Areas without a sufficient amount of passive microtremors will likely need assistance. Thus, a field operator may need to use an impact source to supplement a low passive energy environment. Last, it is worth mentioning that a comparison of Rayleigh wave methods found that the most reliable ReMi data was from “Arrays orientated perpendicular to the highway” or a passive microtremor source. In other words, studies show that passive energy sources that are not in line with the geophone array or that are off to one side of an array were more difficult to interpret.
More about Less common 1-D surface wave applications
Spectral Analysis of Surface Waves (SASW), Passive Remote or Passive MASW Surveys, and Horizontal-to-Vertical Spectral Ratio or HVSR methods are all lesser utilized tools compared to the more popular MASW seismic surveying technique. These surveying techniques utilize the analysis of surface waves in order to detect changes in the subsurface.
Spectral Analysis of Surface Waves (SASW)
The spectral analysis of surface waves (SASW) is a valid technique, yet MASW and ReMi approaches are generally preferred. SASW was an integral part in the evolution of modern-day MASW and ReMi procedures; however, because of its difficulty to interpret as well as not taking advantage of todays multi-channel systems it has become less appealing.
Passive Remote or Passive MASW Surveys
An effective one-dimensional solution that relies mainly on passive surface wave sources is known as Passive Remote or Passive MASW. For optimal results, a nonlinear multi-channel array should be placed in an open and uncluttered area. Geophones are arranged in a wide pattern, such as an “L” shape, triangle, square, cross, or circle. Records thirty seconds or longer are obtained. This common one-dimensional technique leverages both natural and manmade passive surface wave energy to generate a shear wave velocity model that varies with depth. It’s particularly suitable for probing deeper depths (hundreds of feet) below the surface.
Horizontal-to-Vertical Spectral Ratio or HVSR methods
Last, horizontal-to-vertical spectral ratio or HVSR of passive seismic is popular. Without doubt, the equipment is less expensive, portable (e.g Tromino), and easy to use. The method uses a three component geophone to record passive sources arriving from three different orientations (horizontal, vertical, and transverse). After setting up the system, an operator may record data for minutes to hours. Some researchers assert that the credibility of HVSR is based on anecdotal evidence and that well-developed theories in math and physics do not back the method. In contrast, MASW seismic methods are backed by numerous research papers that have successfully unveiled the mathematical and physical principles behind this approach. In the meantime, I am hoping to see the same level of published research on HVSR. Based on my opinion and conversations with those who have used HVSR, the method is low resolution, can be quite time-consuming, not always easy to reproduce (as surveys are often repeated), and its data analysis tends to favor empirical research as opposed to established theory. Some users state this is still better than nothing; however, in areas without other supporting data it may be difficult to determine if one has reasonably good results.
MASW analysis for 2-D MASW seismic surveys
MASW has its roots in the seismic reflection industry. In the early years, oil and gas companies depended on common midpoint or CMP reflection surveys to image the subsurface to great depths. Like MASW, the approach took advantage of recording the response from a large numbers of geophones. The same basic CMP configuration records Rayleigh waves for the MASW method; thus, MASW data can be sorted to yield CMP reflection results. Though it sounds like CMP should be an obvious choice, one may find that CMP reflection surveys are not user friendly to interpret, may be overwhelmed by surface waves, and does not respond to shallow conditions as well as MASW. The greatest benefit of the MASW approach is its ability to produce cost-effective cross-sections of shear wave velocities as a function of depth. MASW stands out from the crowd because of its cost-effectiveness, great resolution, wide range of survey designs, user-friendly and intuitive interface for data interpretation, manageable array lengths, and ability to combine passive energy with rapid data acquisition. Many agree that MASW seismic surveys are the most practical approach for obtaining 2-D or 3-D presentations of surface waves, as alternative methods would require more effort and much less cost effective.
How does one collect 2-D MASW Rayleigh wave records
While I often prefer spiked or planted geophones for greater bandwidth, land streamers respond well to low frequency Rayleigh waves. With planted geophones, an operator often puts out forty-eight geophones and “rolls” through twenty-four at a time. A forty-eight channel seismograph or a twenty-four channel seismograph with a roll box records twenty-four consecutive geophones (e.g., 1-24, 2-25, 3-26,…,23-46, 24-47, 25-48). Each time the system is advanced, the source is advanced one geophone spacing. Some advance further but high-resolution surveys usually advance one geophone spacing at a time. To collect MASW data along an extended distance using planted geophones, the operator simply advances cables one in front of the other, which is known as rolling along. After a roll along, the cables with the lower station numbers (e.g. one through twenty-four) become the high end, twenty-five through forty-eight. The cable that was originally twenty-five through forty-eight remains in place and becomes one through twenty-four. This process continues until the end of a transect is reached.
Alternatively, a land streamer can be used for long transects or spatially large survey areas. This device consists of an array of geophones attached to metal plates. Typically, 24 geophones make up the system to maximize data acquisition. The metal plates are fastened to a tow strap at predetermined spacings. The survey design optimizes the spacing between metal plates for the desired depth of investigation. In the field, the land streamer is laid out in a straight line and towed across a site stopping at locations to record a seismic record. After storing a record, the field operator pulls the geophone array ahead a predetermined distance. For higher resolution surveys, the array is advanced the equivalent of one geophone spacing. For less demanding investigations, the array can move much larger distances, which are usually multiples of the set geophone spacing. This technique of towing a land streamer is extremely useful for long distances. If a site is very large or one has a limited amount of time, one may advance the land streamer a distance equal to many geophone spacings. This may lead to a loss of lateral resolution. However, it is not usually an issue for bedrock surveys or areas that have fairly homogeneous and isotropic conditions. One disadvantage of a land streamer is keeping good contact with the ground. Areas with heavy vegetation may lift the geophones off the ground or tilt them. In these situations, field personnel need check the land streamer and make sure each geophone is in good contact with the ground’s surface.
MASW analysis for 3-D MASW seismic surveys
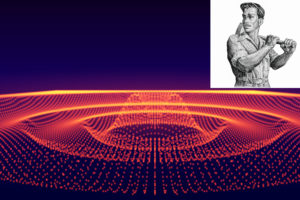
Currently, the more common 3-D MASW surveys are an extension of 2-D methods. Multiple 2-D MASW lines generate 3-D presentations. Software takes 2-D plots and assigns 3-D spatial coordinates. Thus, data values from a 2-D presentation have an X and Y coordinate assigned (represents a location at the surface), a value Z that represents a depth or elevation, and a value of for the shear wave velocity at that point in space. Subsequently, each modeled shear wave velocity has an X, Y, Z coordinate. To visualize the data, one uses 3-D presentation software (e.g. Golden Software’s Voxler program) or arrange the data into depth slices. The depth slices use only the X and Y coordinates for a constant depth or elevation. Only shear wave velocities from a specified depth or elevation are grouped together. Then, one can use a contour package to present the shear wave velocities in plan view. Each plan view reflects a depth of investigation.

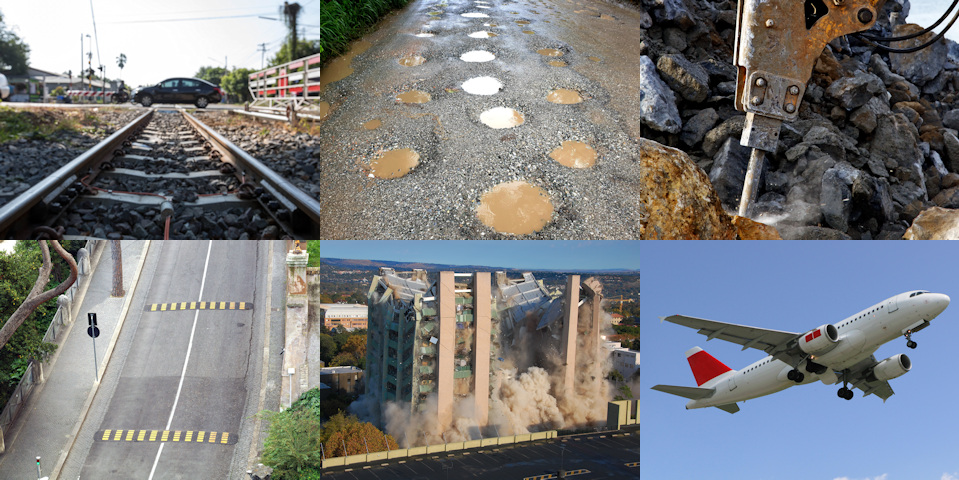
Why MASW seismic methods for geology, seismic site classification, voids, sinkholes, fill, and anomalies
1-D, 2-D, and 3-D MASW surveys with active, passive, and combined sources, methods, and applications

MASW seismic services, processing, equipment, rentals, and software
MASW case histories on mapping bedrock, mine reclamation, vibratory hammers

Special MASW content on theory, concepts, innovations, concerns, and credits
Contact MASWSeismic.com